Monday, November 27, 2017

International Cotton Market Report as on 24th November 2017

Last Night NYC Closing
ICE COTTON CLOSING PRICE
DateContractsChangeOpenHighLowSettlePKR
24-11-2017Dec 180.4170.9471.270.771.116167.22
24-11-2017Mar 180.7971.1472.0871.0771.936238.34
24-11-2017May 180.8471.9272.9371.9272.826315.53
24-11-2017Mar 190.3570.9270.9270.9270.926150.74
24-11-2017Oct 180.5


71.536203.65
24-11-2017Mar 190.3570.9270.9270.9270.926150.74
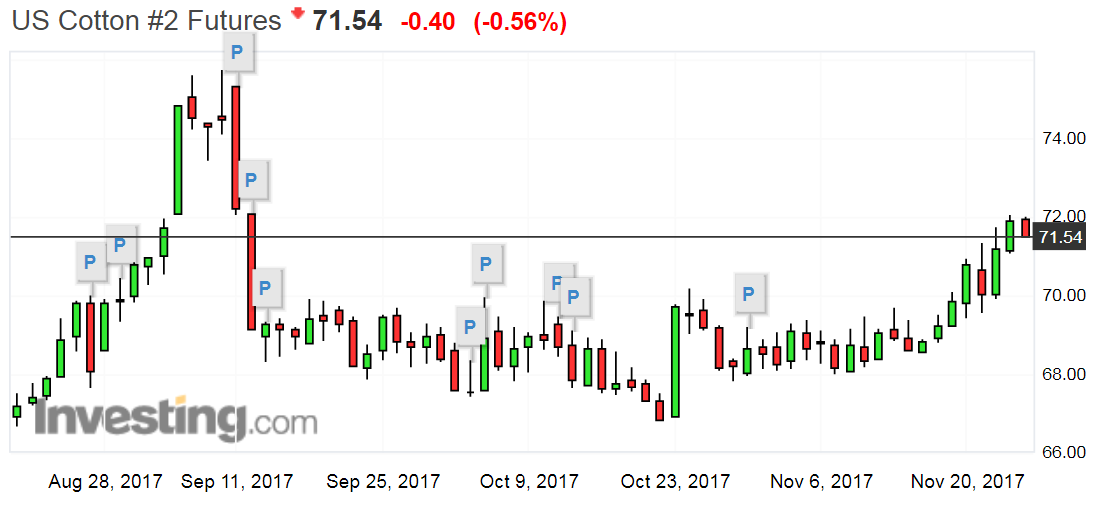
cotton market technical chart

World & Domestic Cotton Market


Current PricePrices on same Date Last Year (24-11-2016)
COTLOOK
Cotlook Index (cents/lb) ‘A’ Index81.6080.50
USA
New York Cotton Market Contract No.2
(cents/lb)’Dec-201771.9372.38
Mar-201872.8271.30
(24-11-2017)
CHINA
China Cotton Index Yuan/M . Ton15,88115,999
(27-11-2017)
INDIA
S6 29 MM (Per Candy)37000-3730038800-39100
V797 – 22-23 mm (Per Candy)28700-3210027000-32800
MCU5 30-31 mm (Per Candy)37700-3860039300-39800
(25-11-2017)
PAKISTAN
Karachi Cotton Association (Spot Rate)6,7456,385
Ex-Karachi7,2286,843
Rs. per 40 kgs. Rs. per maund (Equivalent cents/lb.)77.7774.33
(24-11-2017)

NYC Closing For The Week #47

DaysPriceOpenHighLowChange %
22-Nov-1771.1970.0671.7569.911.60%
21-Nov-1770.0770.6671.3469.55-1.05%
20-Nov-1770.8169.8570.9269.431.33%
17-Nov-1769.8869.2370.0869.230.88%
16-Nov-1769.2768.9669.5068.810.60%
Source: ICEDated: 22-11-2017 

International Sugar Market Report 27th Novembert 2017

Sugar Market Commentary:
  • General Comments:

    Futures were lower in both New York and London again yesterday. Futures have now fallen back into the recent range. Chart patterns are more neutral now due to the weakness in futures as a breakout higher seems to be failing. Brazil features reduced sugarcane crush and continued emphasis on ethanol production and reduced Sugar production as it moves to cover domestic demand at the expense of exports. Trends are turning up in London and in New York after the price action last week on ideas of reduced availability of Sugar to the market. There have been no big demand reports, and the lack of demand against ideas of big world production are keeping the market in a fundamentally bearish mode. Even so, the charts in both New York and London imply that higher prices are still possible
  • Overnight News:

    Brazil should feature showers and storms this and next week and drier weather this weekend. Temperatures should be near to above normal today and tomorrow, then near to below normal
  • Chart Trends:

    Trends in New York are mixed. Support is at 1480, 1460, and 1430 March, and resistance is at 1520, 1550, and 1580 March. Trends in London are mixed. Support is at 383.00, 380.00, and 377.00 March, and resistance is at 393.00, 396.00, and 399.00 March.

Landon Sugar # 5 Closing

MonthSettleChangeHighLowTotal Vol.
Mar 18397.10 2.3397.90394.003573.00
May 18399.70 1.1400.80397.801390.00
Aug 18404.10 1.3404.80401.90442.00
Oct 18405.80 1406.50404.3090.00
Dec 18410.90 0.2411.30410.7058.00
Dated: November 24, 2017Source: ICE
International Sugar Market Report 27th November 2017 For Complete Report : Click Here

Wednesday, September 27, 2017

International Sugar Market Report 27th September 2017

[panel title="Sugar Market Commentary" class="col-md-8 col-lg-8 col-sm-12 col-xs-12" headingbg="#147534" headingfg="#fff" headingsize="20px"]

General Comments:

Futures were lower in both New York and London on more forecasts for rains in Brazil production areas. The precipitation is expected by the end of the week, and initially will provide poor coverage. But it is a sign that the rainy season is coming and ideas are that production potential for Brazil can now start to improve. The rains come as the market thinks more and more about La Nina and the potential for drought in pasts of Brazil this year. Cash markets show weakening differentials between whites and raws, so London remains the weaker futures market. Weaker differentials imply either too much production or too little demand or both. Brazil mills are now processing more for ethanol than Sugar as the ethanol pays better and processors can get some better tax treatment in the country. Upside price potential is limited as there are still projections for a surplus in the world production,and these projections for the surplus seem to be bigger. Trends are sideways in New York and sideways to down in London.

Overnight News:

Brazil should feature warm and dry weather for the next week. China imported 196,578 tons of Sugar in August, down 45% from last year. Calendar year to date imports are now 1.7 million tons, down 21% from last year.

Chart Trends:

Trends in New York are mixed. Support is at 1430, 1410, and 1380 March, and resistance is at 1490, 1520, and 1550 March. Trends in London are mixed to down with objectives of 357.00 and 340.00 December. Support is at 360.00, 354.00, and 348.00 December, and resistance is at 372.00, 375.00, and 384.00 December.

London Sugar # 5 Closing

Month Settle Change High Low Total Vol.
Dec 17 355.60  -6.60 365.20 354.50 5,244
Mar 18 362.50 -8.00 373.30 361.80 3,093
May 18 372.20 -9.30 384.00 371.60 563
Aug 18 382.10 -393.80 381.40 381.40 428
Oct 18 388.50 -9.30 400.50 387.90 102
Dated: 26-09-2017 Source: ICE
london-sugar-candlestick

Sugar # 11 Closing

Month Settle Change High Low Total Vol.
Oct 17 13.21 -0.53 13.88 13.11 39,810,
Mar 18 13.91 -0.44 14.47 13.81 65,641
May 18 14.10 -0.43 14.64 14.01 13,414
Jul 18 14.33 -0.41 14.85 14.26 3,963
Oct 18 14.75 -0.39 15.21 14.66 2,464
Dated: 26-09-2017 Source: ICE
london-sugar-candlestick


For Complete report Cleck Here